Requirements
- EKS cluster (deployed in the last step here) deployment completed.
- Kubectl configured with access to the EKS cluster.
- Helm.
Install the Sysdig Agent
The next steps will deploy the Sysdig Agent in all the nodes of the EKS deployed during the prerequisites step.
Log into Sysdig Secure, and browse to Integrations > Data Sources > Sysdig Agents, then Connect a Kubernetes Cluster. Insert a cluster name of your choice (for example
aws-workshop) and it will be inserted in the resulting command.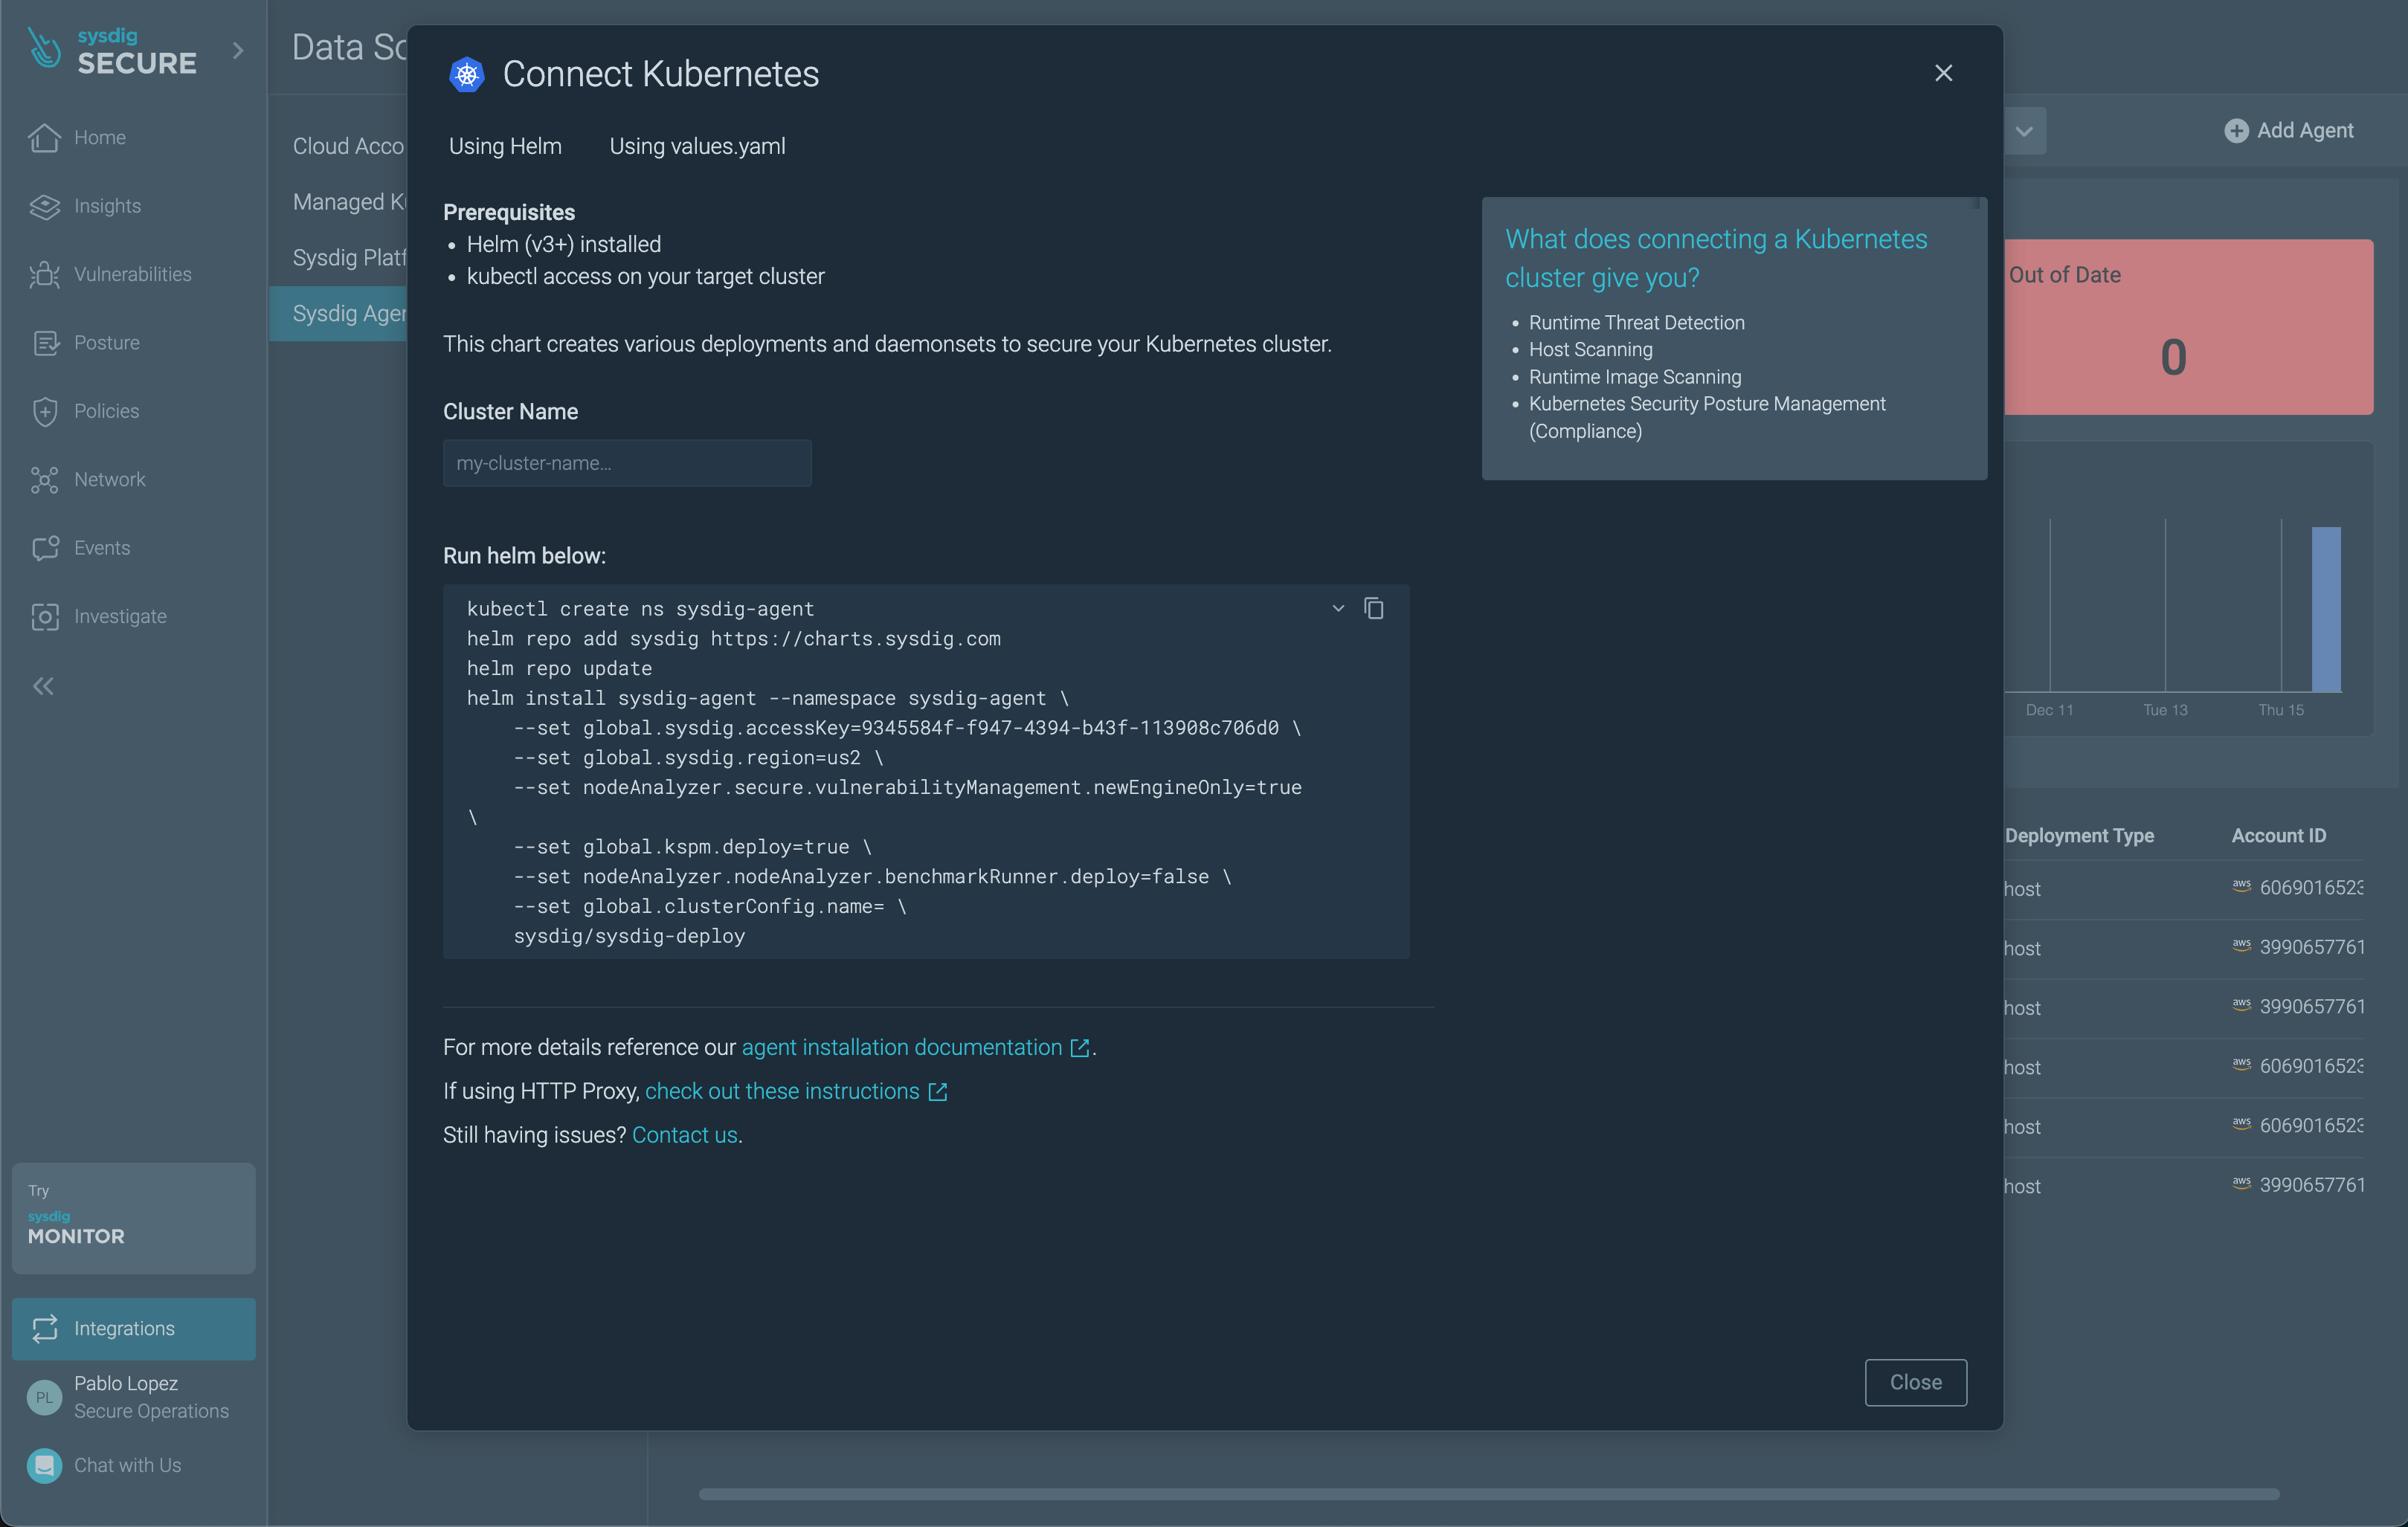
The *Risk Spotlight In-Use fature is not deployed by default with generated command.
Copy the following command to your IDE to and replace the placeholders
<SYSDIG-TOKEN>(settings > Agent Access Keys),<SYSDIG-REGION>(us1, us2, us3, us4, eu1, or au1),<YOUR-CLUSTER-NAME>(chose a meaningful name).helm repo add sysdig https://charts.sysdig.com helm repo update helm install sysdig-agent --namespace sysdig-agent --create-namespace \ --set global.sysdig.accessKey=<SYSDIG-TOKEN> \ --set global.sysdig.region=<SYSDIG-REGION> \ --set nodeAnalyzer.secure.vulnerabilityManagement.newEngineOnly=true \ --set global.kspm.deploy=true \ --set nodeAnalyzer.nodeAnalyzer.benchmarkRunner.deploy=false \ --set global.clusterConfig.name=<YOUR-CLUSTER-NAME> \ --set nodeAnalyzer.nodeAnalyzer.runtimeScanner.settings.eveEnabled=true \ --version 1.23.10 \ sysdig/sysdig-deployExecute the resulting command in your terminal. The Sysdig Agents are being deployed now on each of the nodes of the cluster.
Sysdig Secure Policies
When the installation is complete, visit the Runtime Policies section and filter the list of policies by type: Kubernetes Audit. Then, enable the Sysdig K8s Activity Logs and Sysdig K8s Notable Events policies. These policies will alert about each and every K8s Audit Event in your EKS cluster.
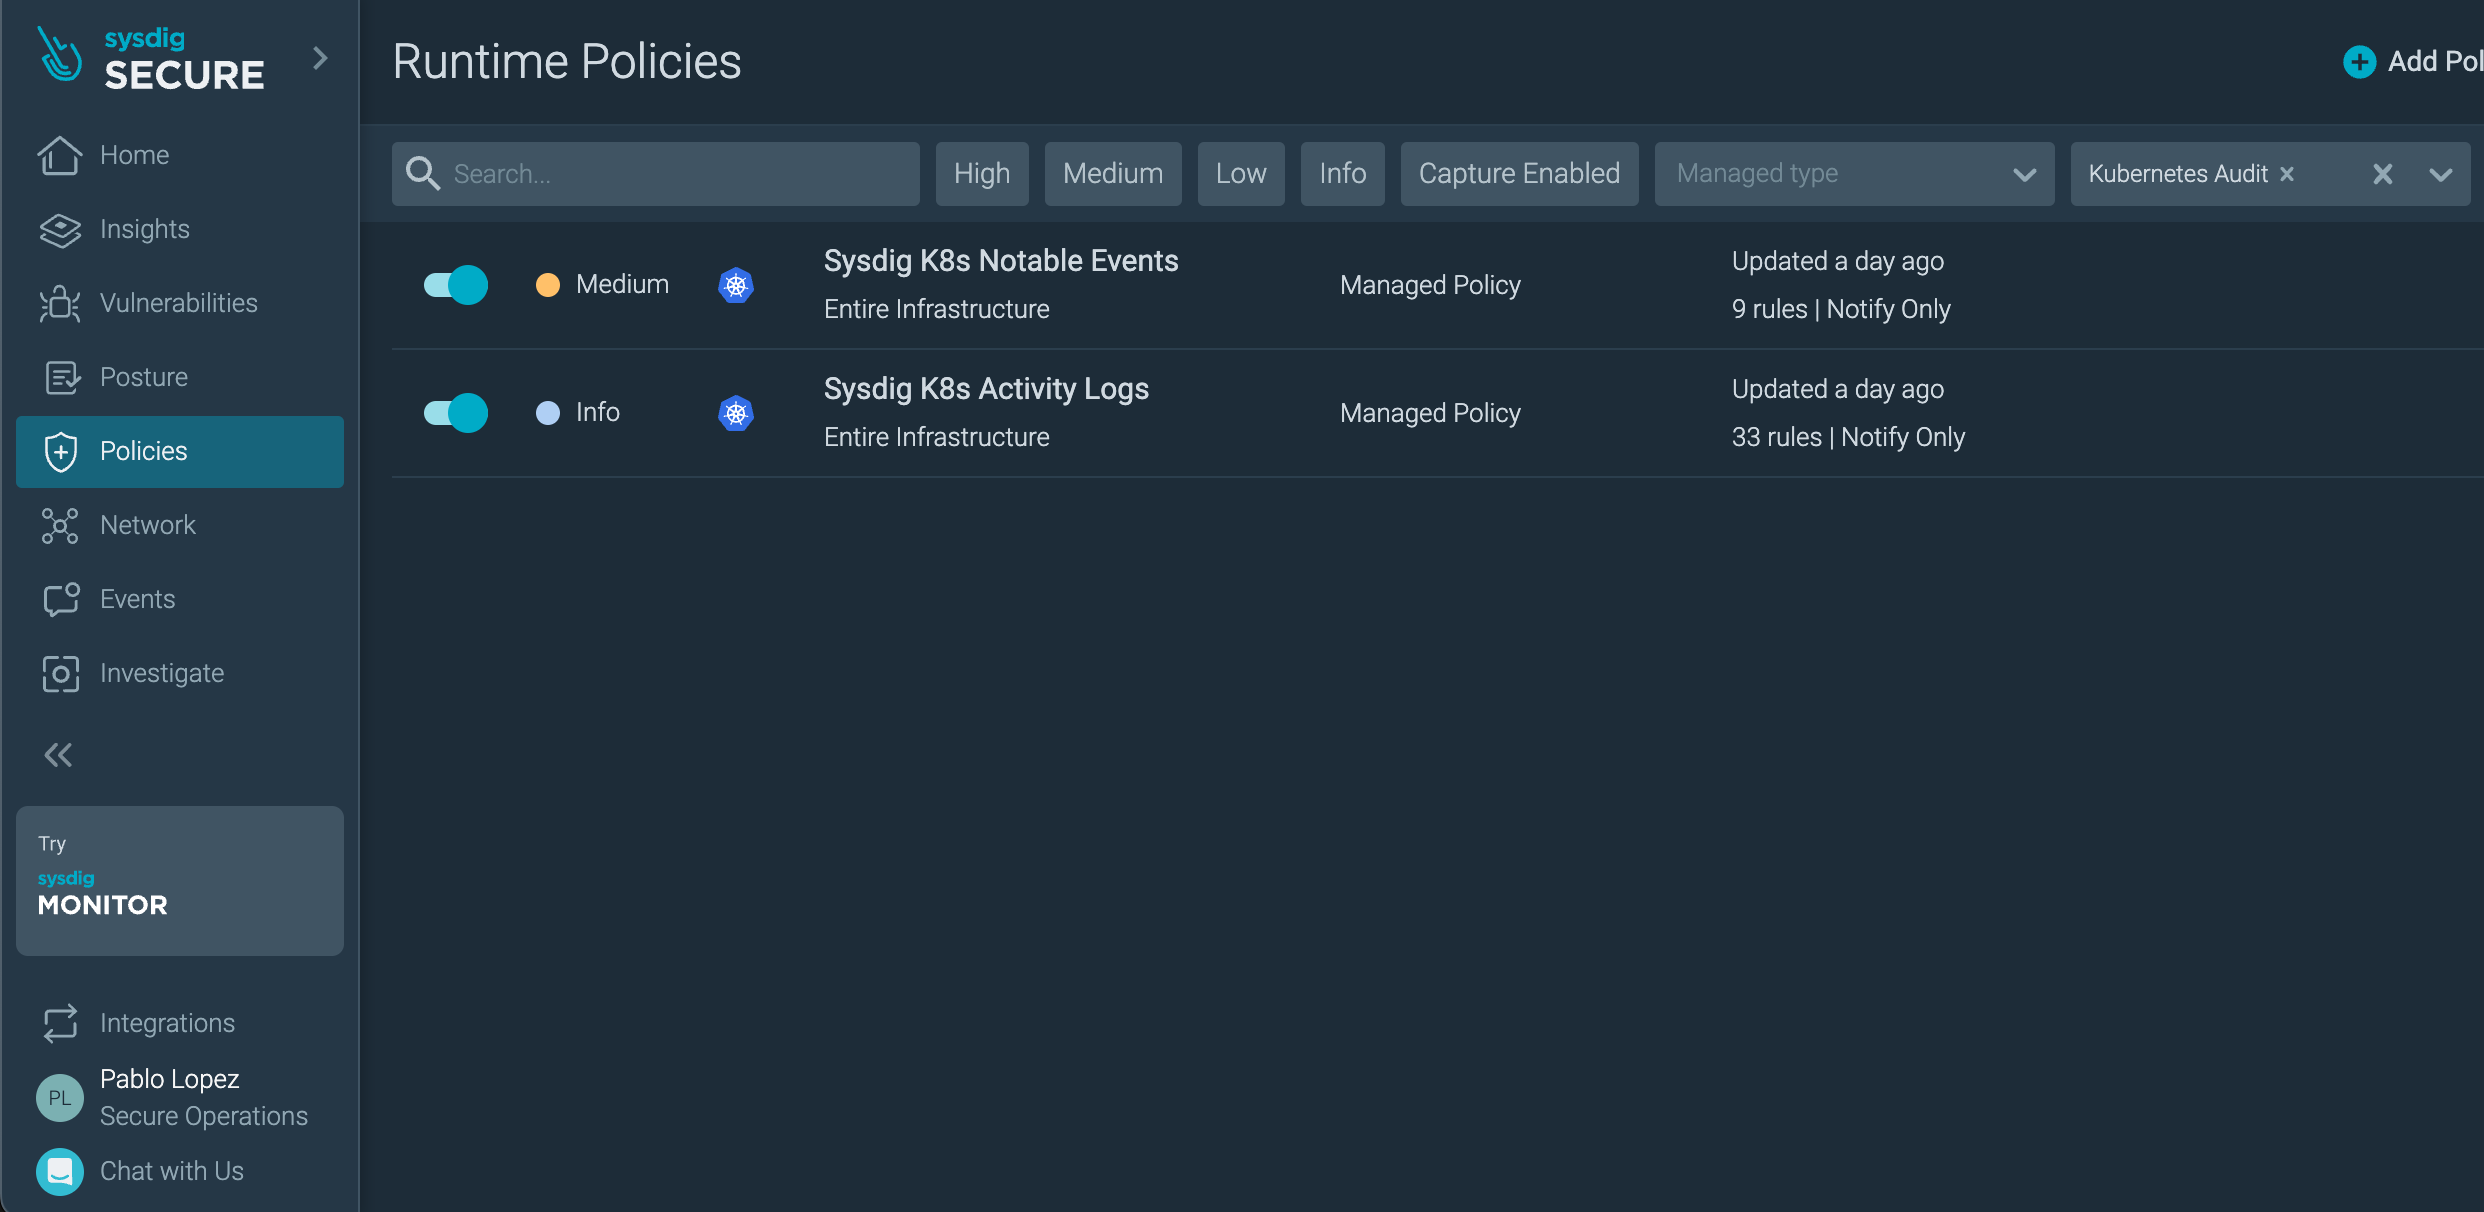
After this, filter too by:
AWS CloudTrailand enable all the available policies.Workloadand enable all the available policies.
Create a new policy, select type Worload Policy.
From the rule library, add the rule: Write below etc
name it aws-workshop-test-policy, add a description foo
and enable Captures.
Review installation
Agents
Check that the Agent installation was successful in the Integrations > Data Sources > Sysdig Agents section.
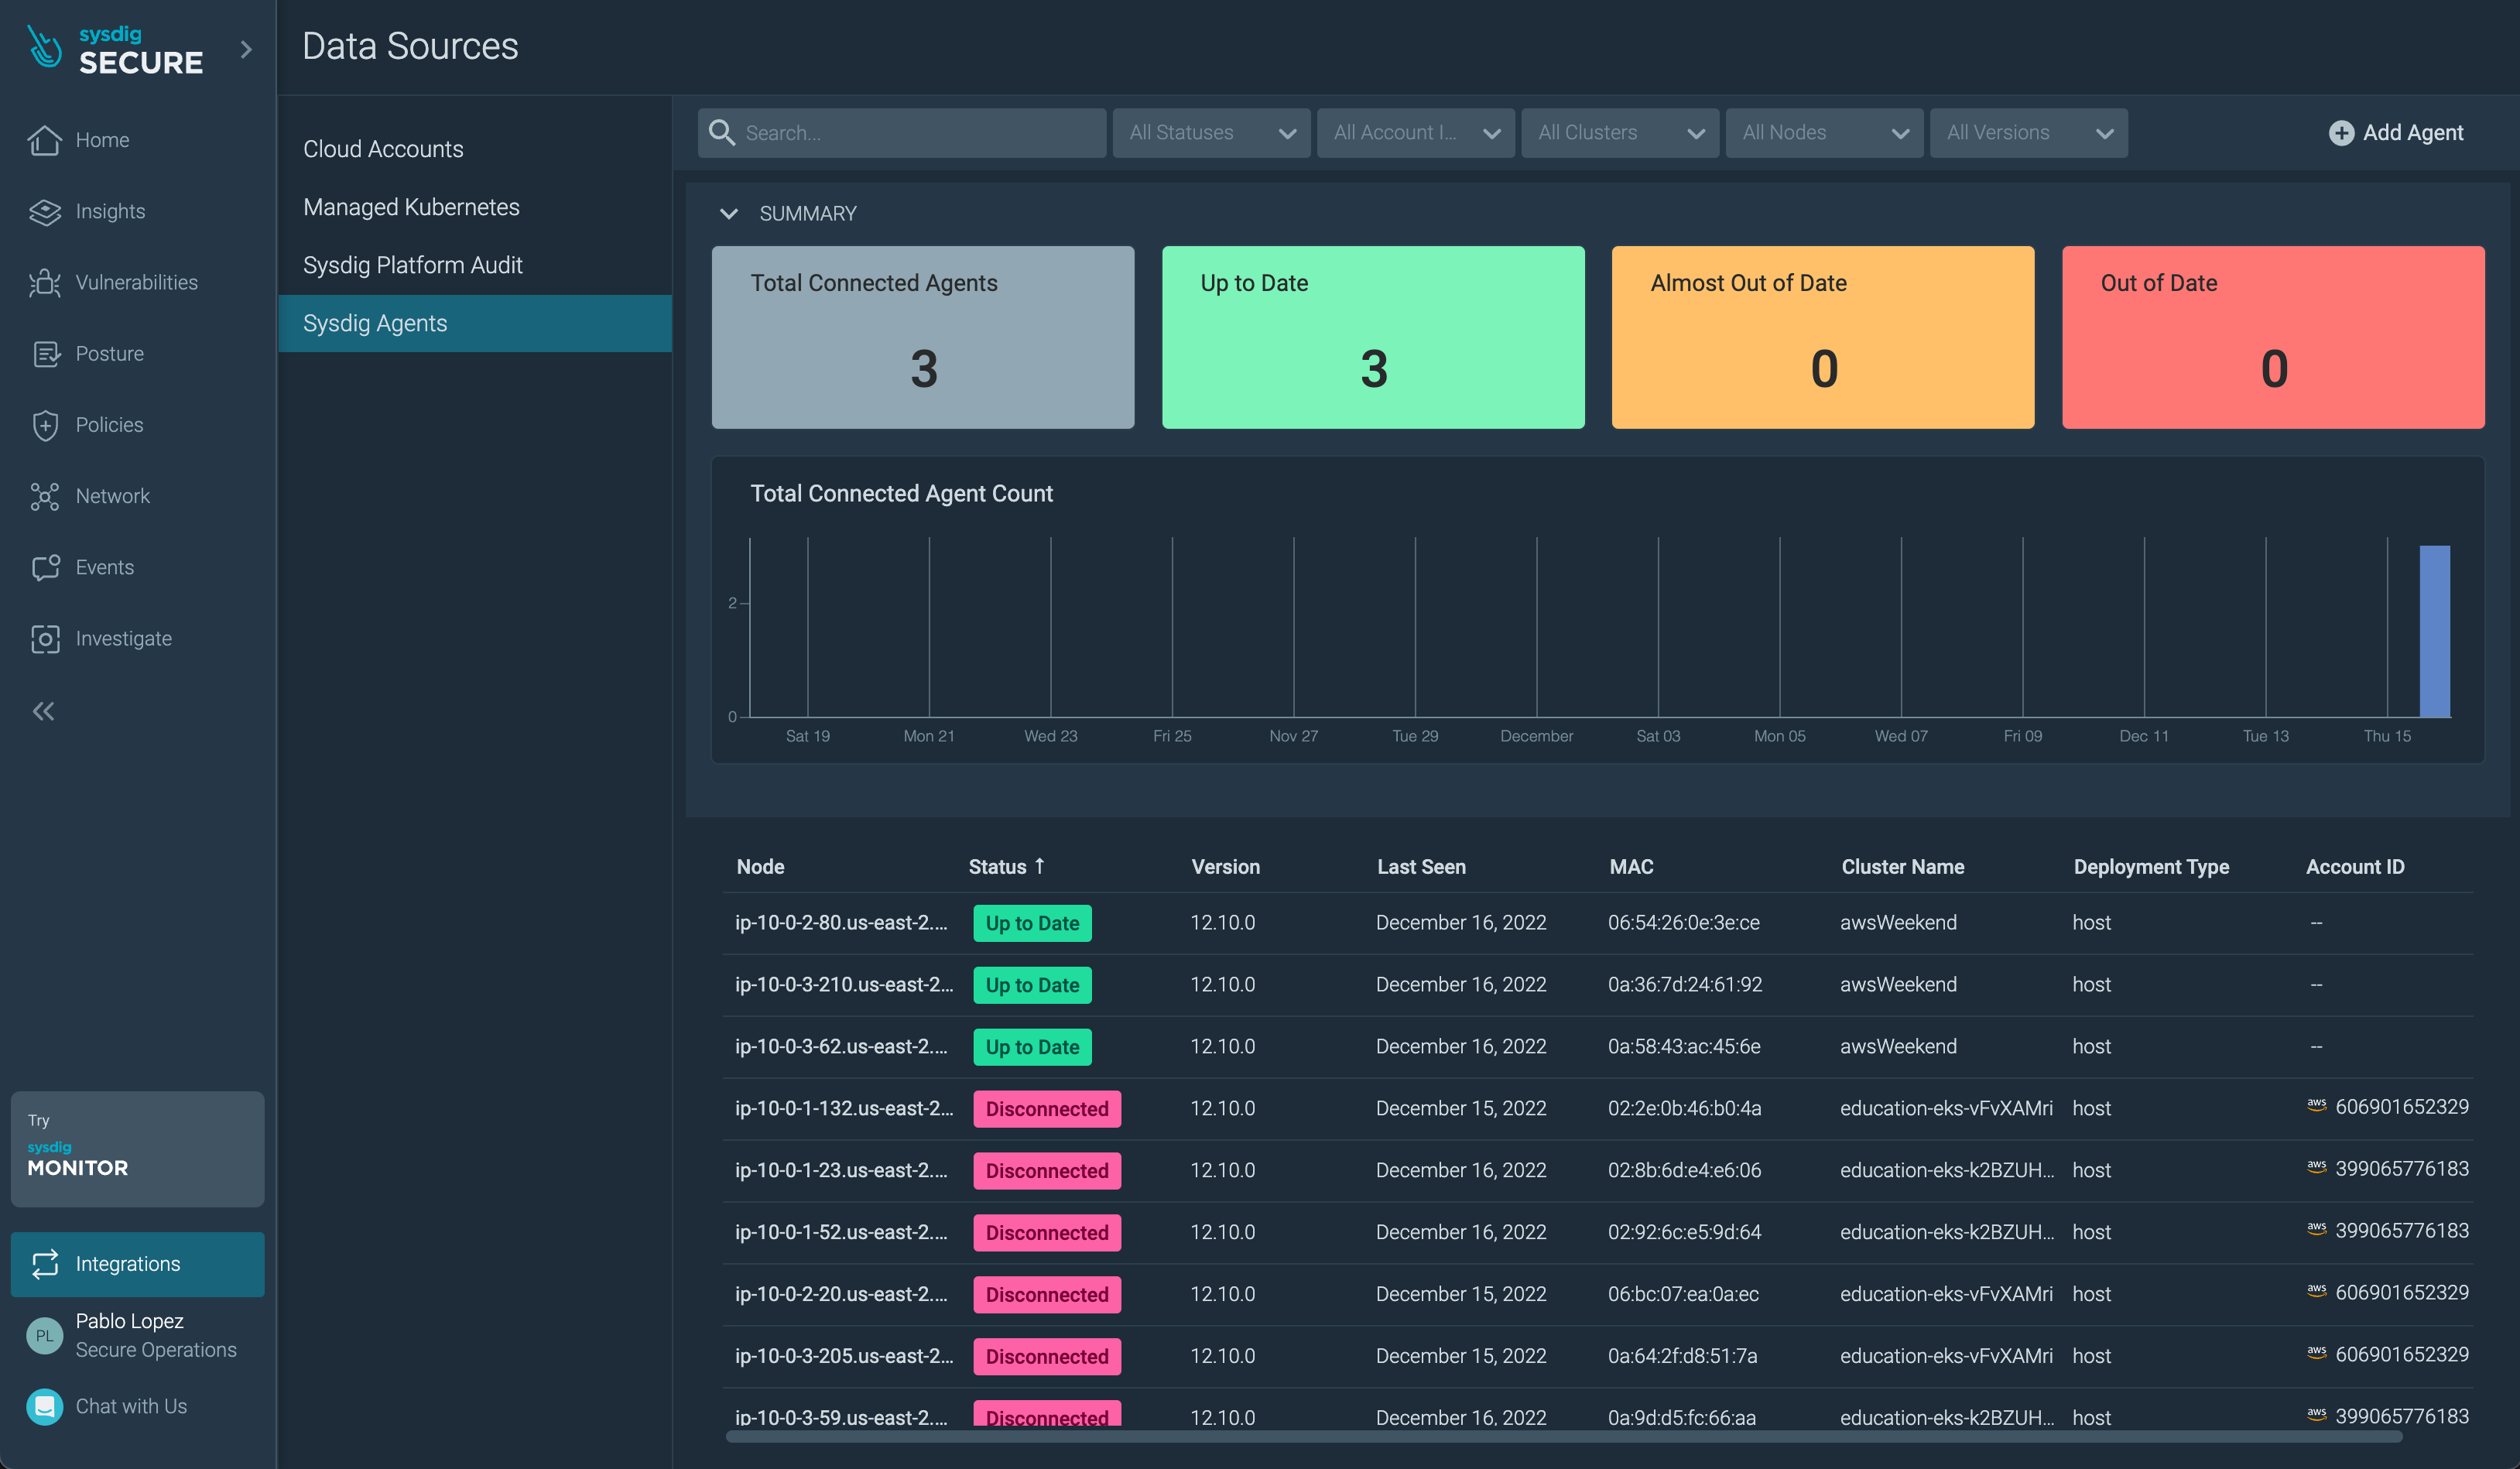
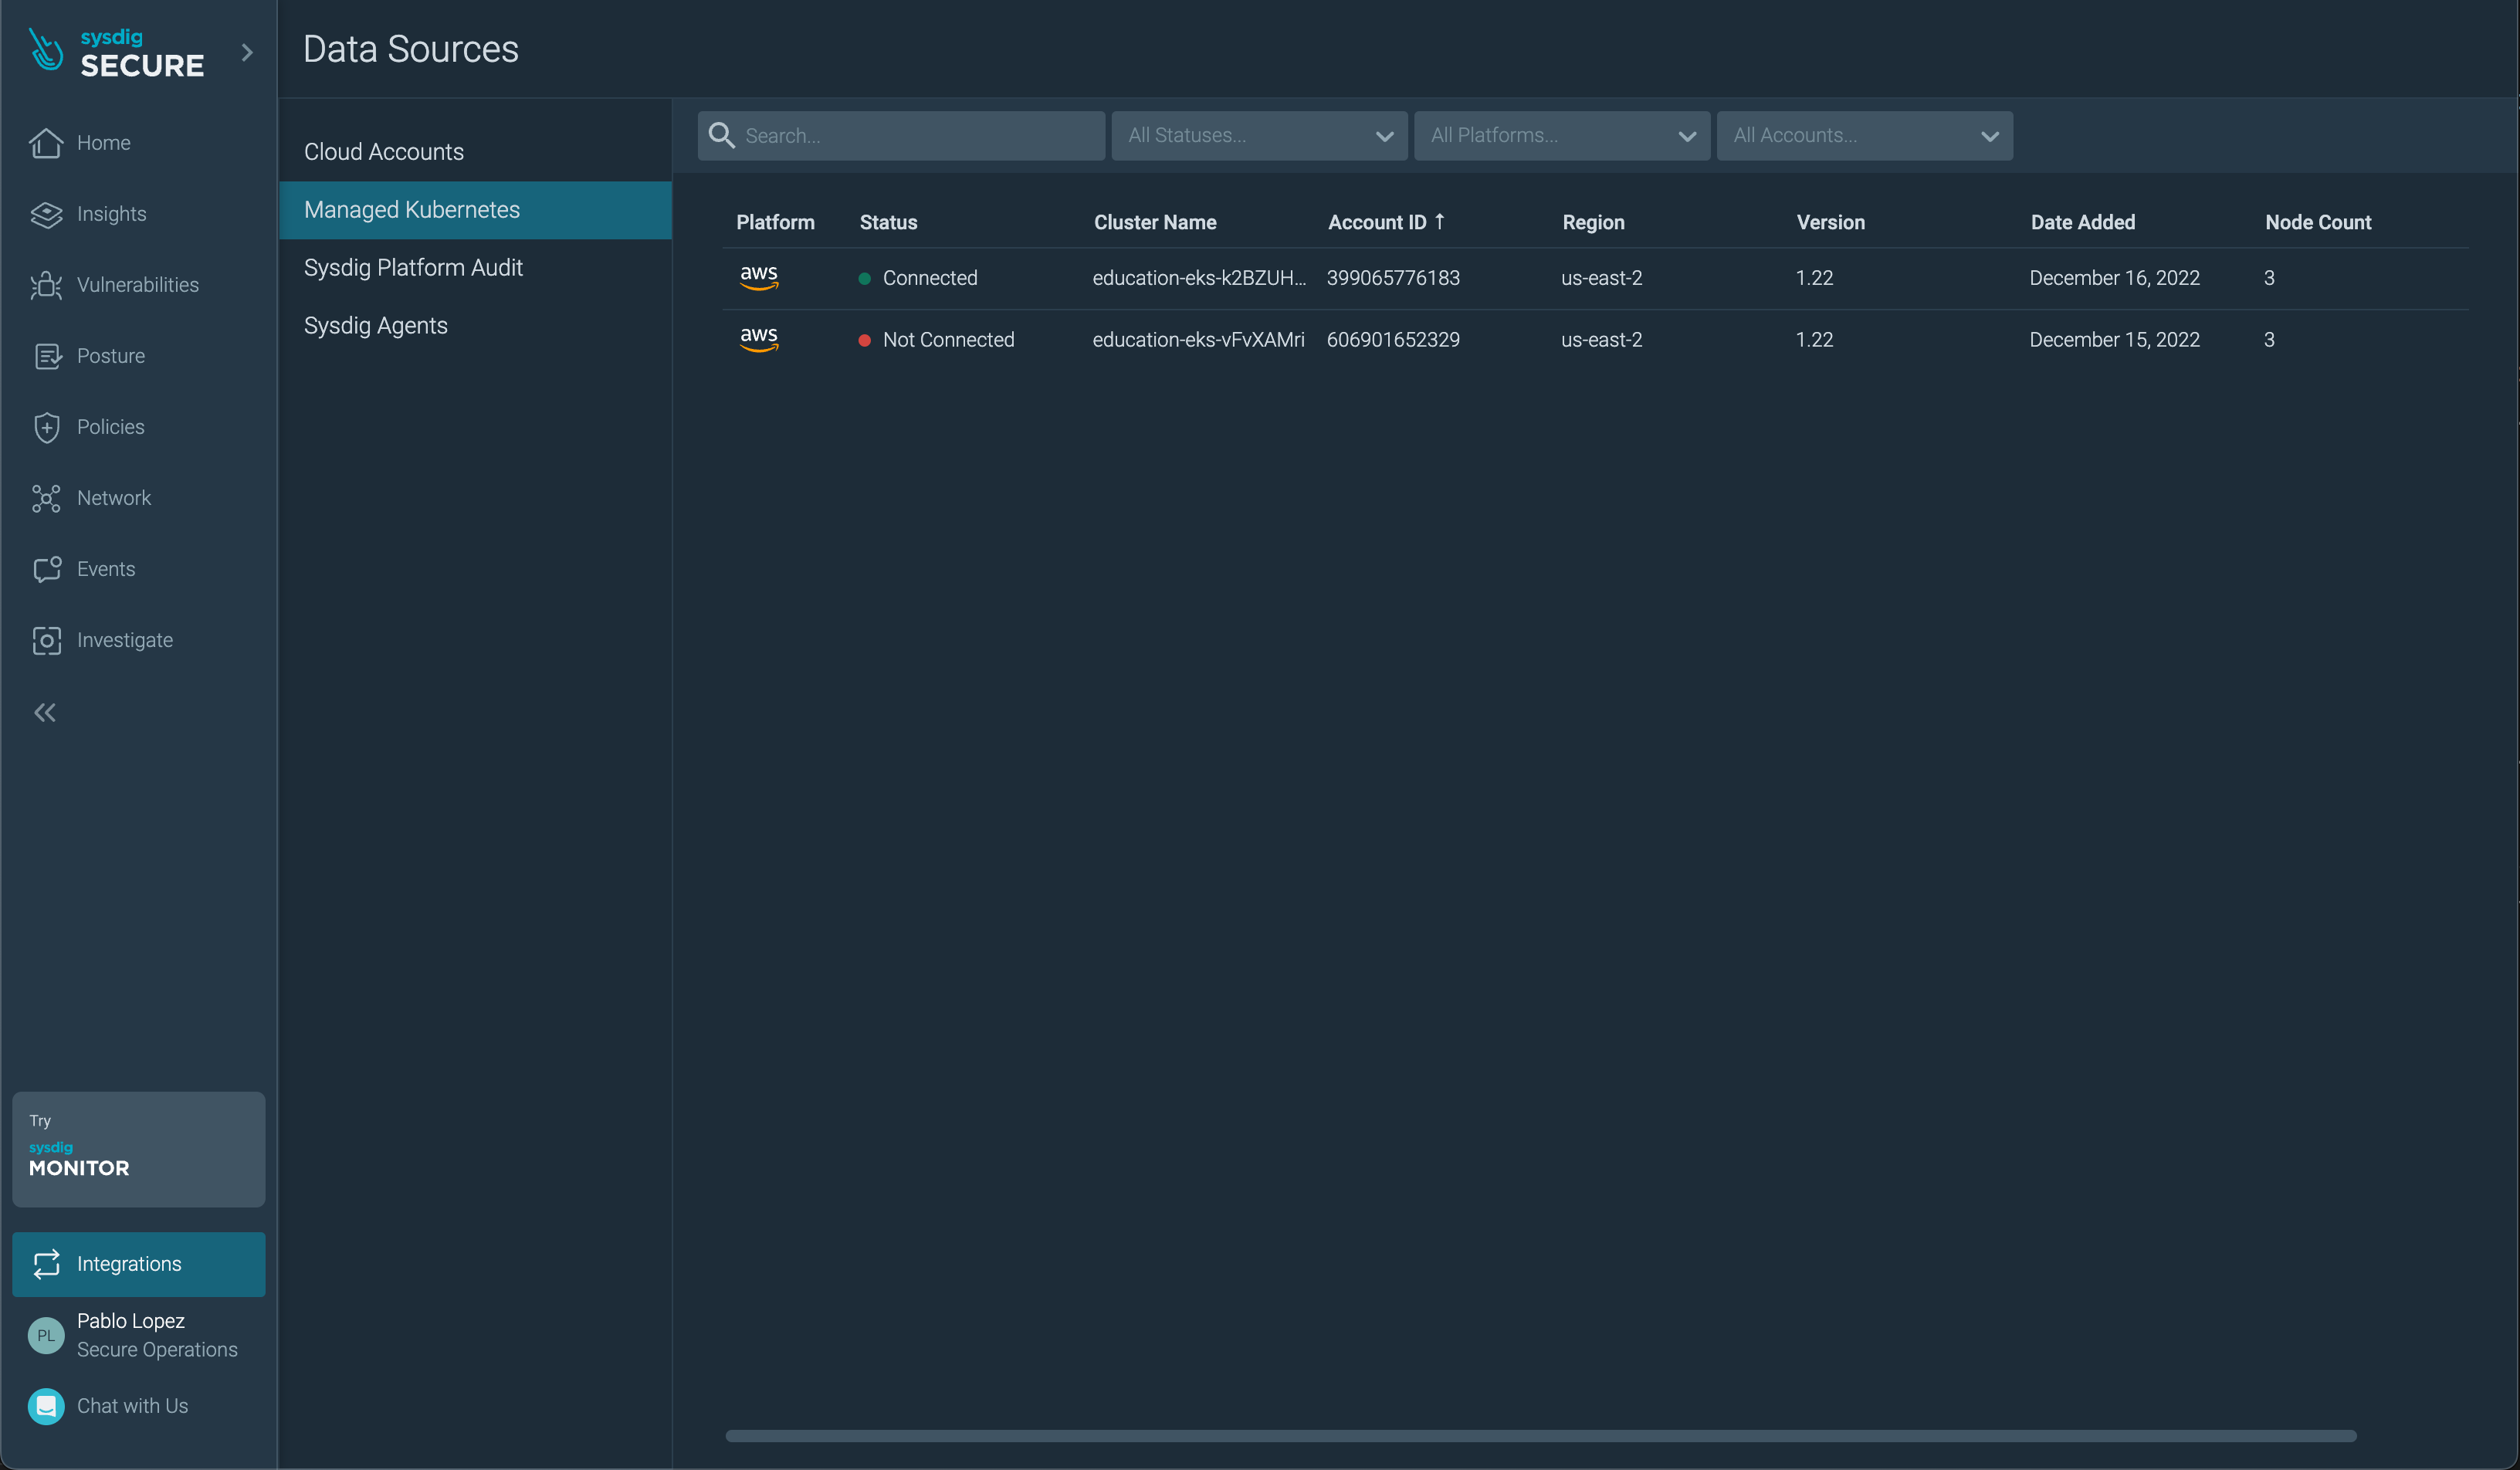
The EKS cluster will also be visible in the Managed Kubernetes section.
Alternatively, you can check the logs of the agent pod:
kubectl logs -l app.kubernetes.io/name=agent -n sysdig-agent --tail=-1 | grep "Sending scraper version"
Admission Controller
Check that the Admission Controller installation was successful by generating an event that will be registered in the k8s API:
Trigger some events with:
kubectl exec -n sysdig-agent \
    $(kubectl -n sysdig-agent get pod -l app=sysdig-agent \
        --output=jsonpath={.items..metadata.name} \
    | cut --delimiter " " --fields 1) -c sysdig -- ls /bin/ > /dev/null

kubectl run nginx --image nginx --privileged
Then, visit the Events section and it will show up after you select the Info level.
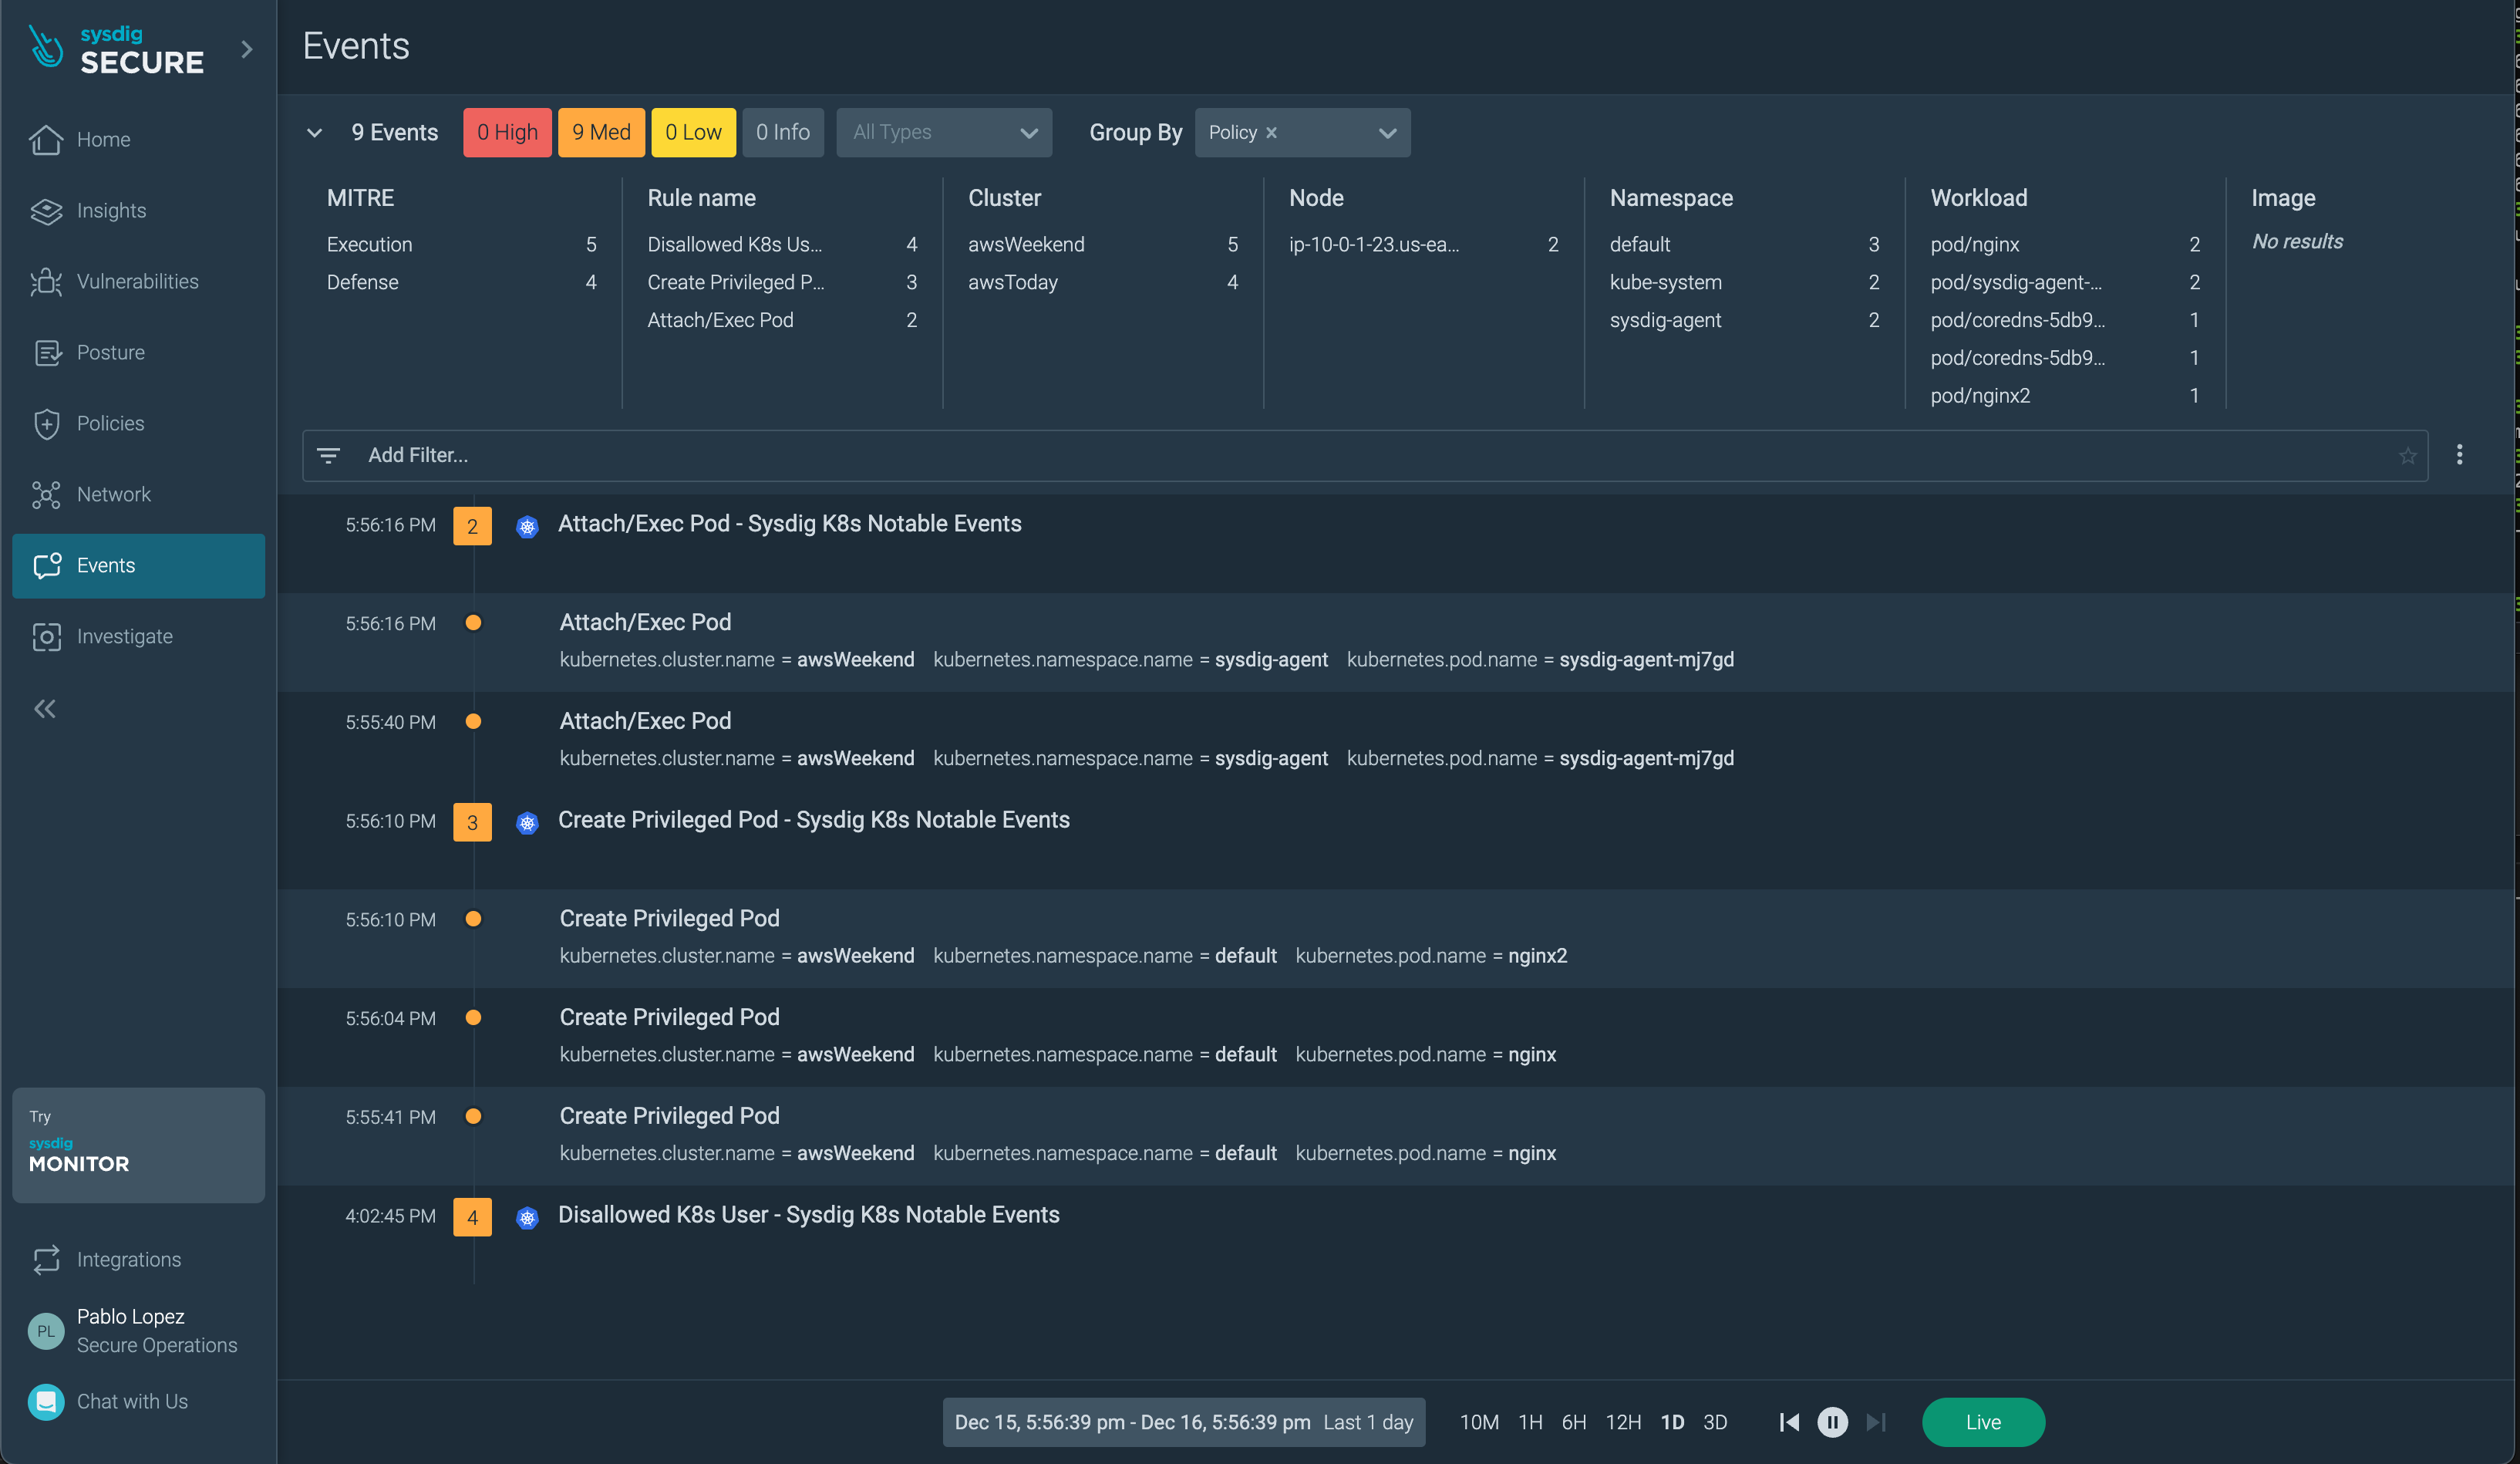
Alternatively, check the admission-controller pod logs:
kubectl logs -f -n sysdig-agent \
    -l app.kubernetes.io/component=webhook \
    --tail=-1 --follow=false
Every action against the K8s API Server will generate an entry in the logs (based on the configured logging level). You should see something like this:
...
{"level":"info","component":"console-notifier","time":"2022-12-15T15:20:11Z","message":"Pod started with privileged container (user=kubernetes-admin pod=222nginx111 ns=default images=nginx)"}
...