Insights Visualisation
Cloud assets are growing in complexity and number. How about having a full view of all your cloud infrastructure and its key assets? Sometimes it is difficult to see the resources and how are they organized, events that occur, where and which users were involved in the incident. Sysdig provides you with all this information in a simple graphical view.
In Sysdig Secure, navigate to ‘Insights > Cloud Activity’
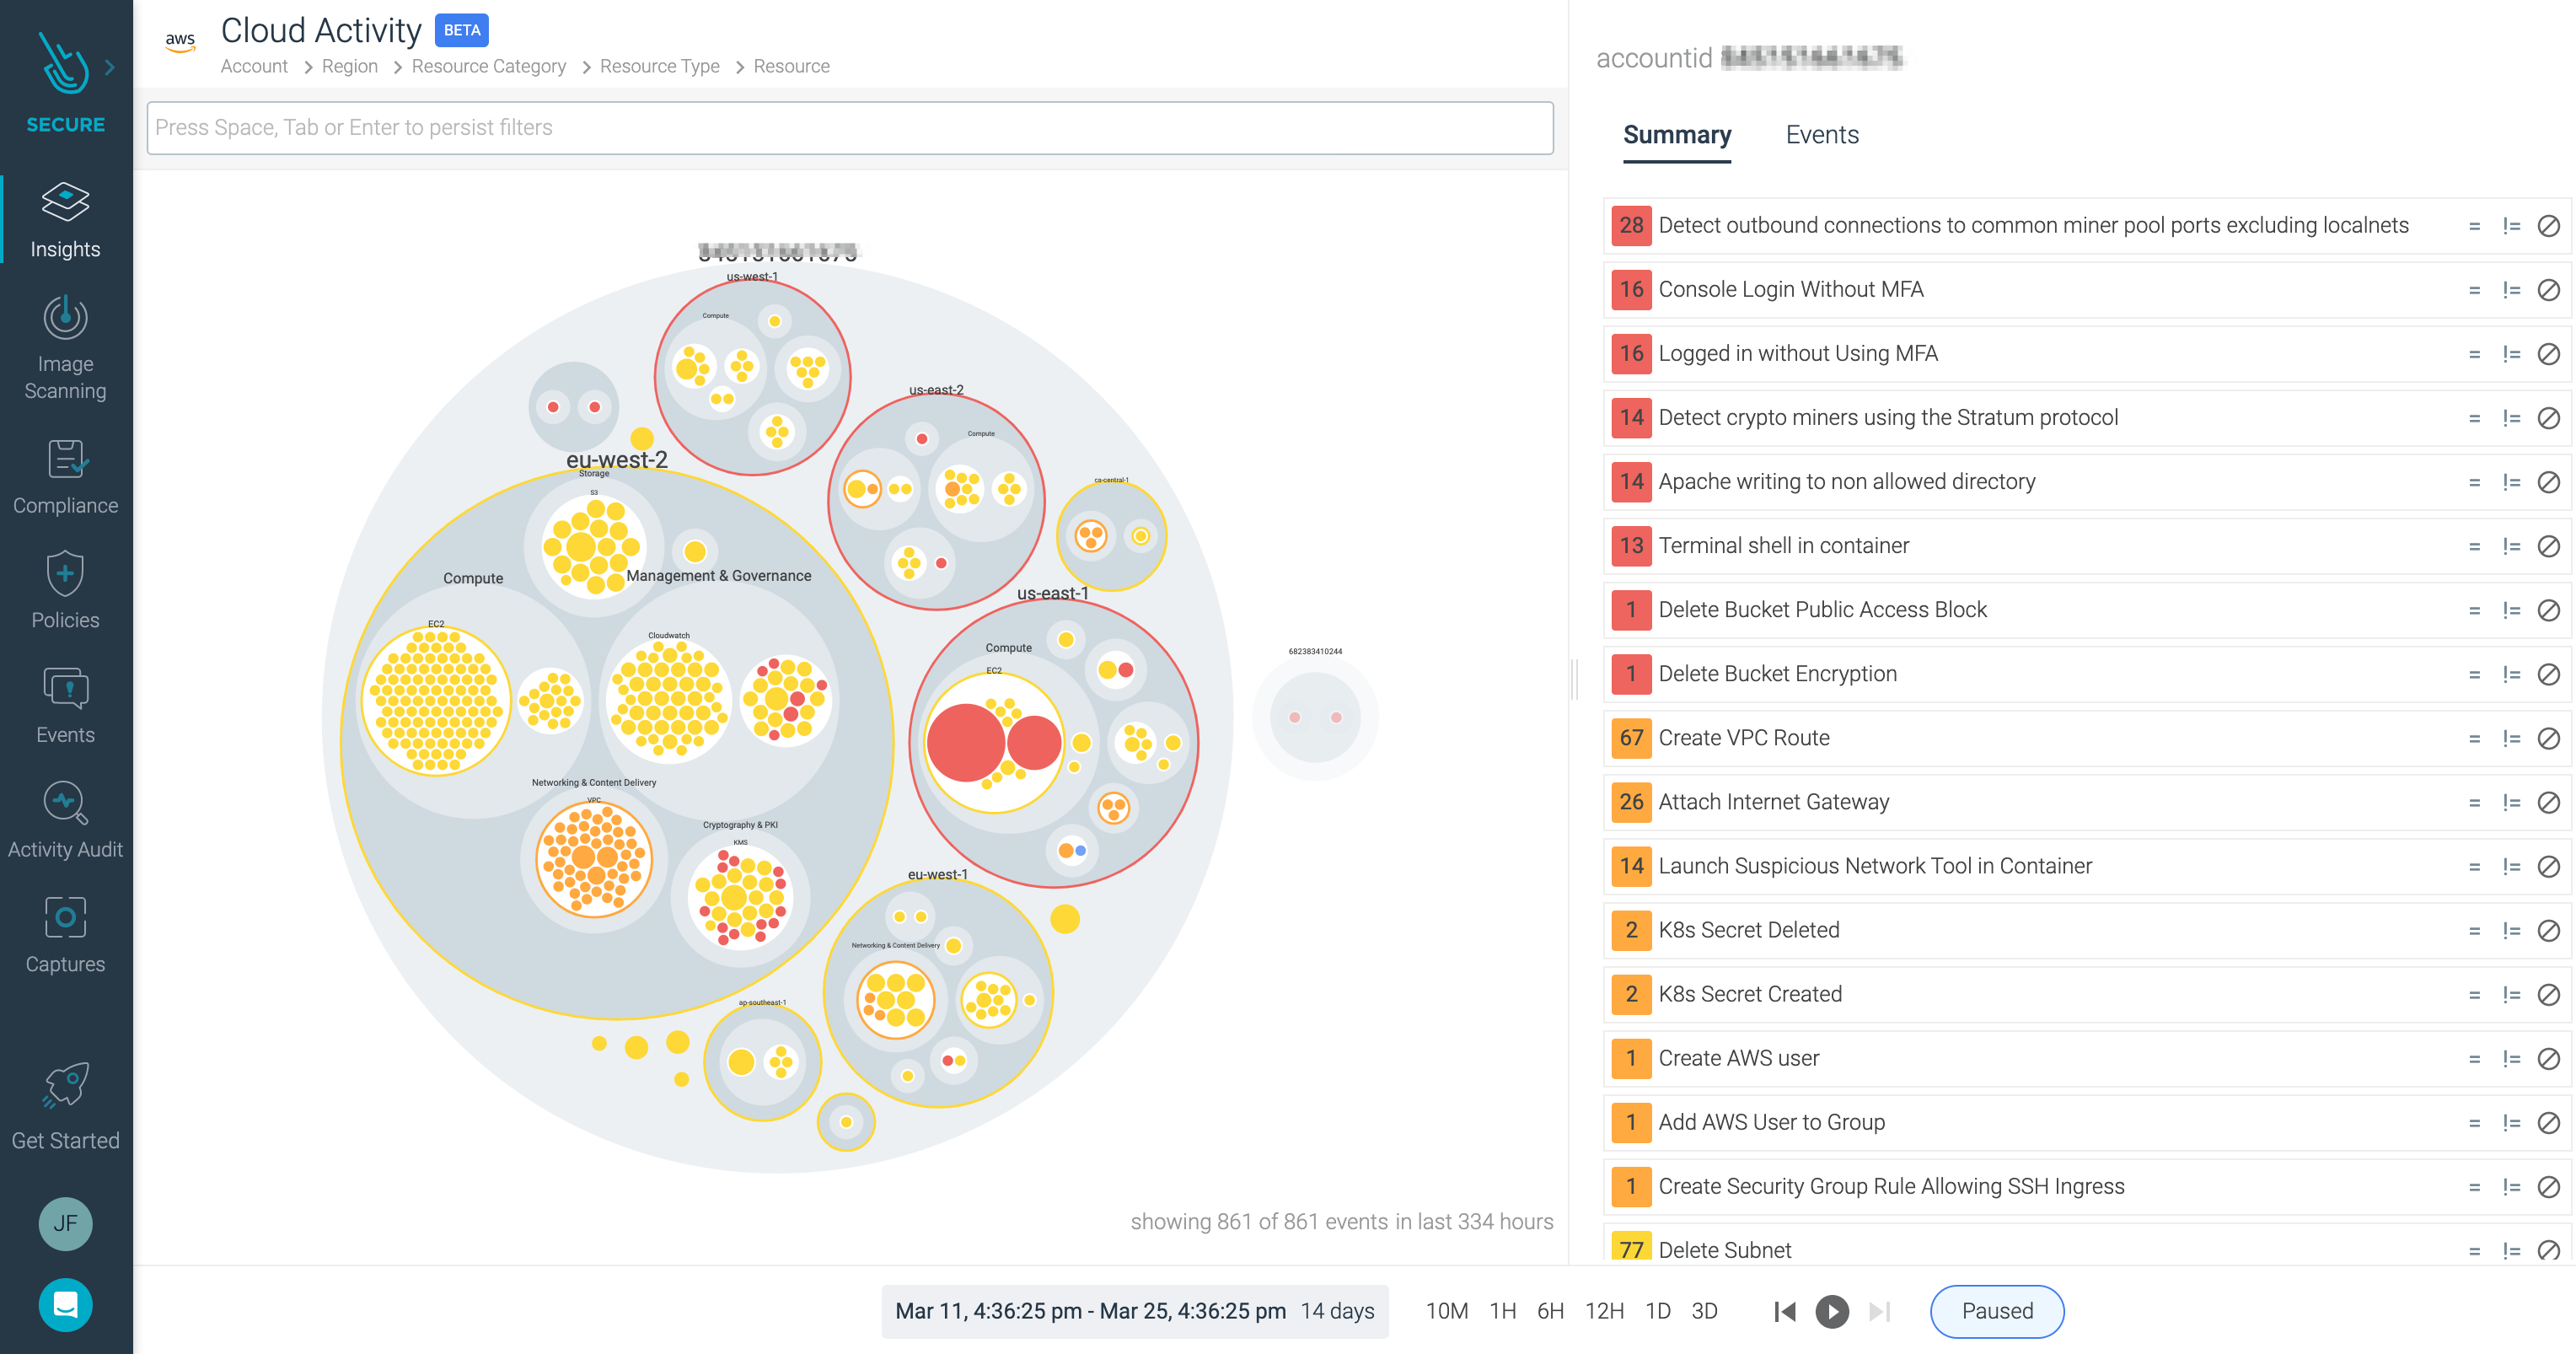
Here we can see each AWS account on which Sysdig Secure for cloud was deployed.
The largest bubble identifies an AWS account with the smaller bubbles within it signify the active regions. The bigger the bubble, the more activity in that region.
Move the mouse around within a region and you will see the sub-bubbles refer to the resource type - EC2, ECS, S3, etc. Further sub-bubbles within each of those represent individual resources.
Next to the visualization of all the data, we can see a feed with the security events, ordered by event type and severity or by time.
Select one of these events, for example the “Logged in without using MFA”.
We are presented with all the data we need to identify where and how the security incident happened:
Aws.accountidaws.userAws.regionAws.sourceIP
As normally within Sysdig Secure, you can easily identify which rule & policy triggered this Security Event.
Let’s see another example.
Select the Kubernetes Activity view in the top left corner.
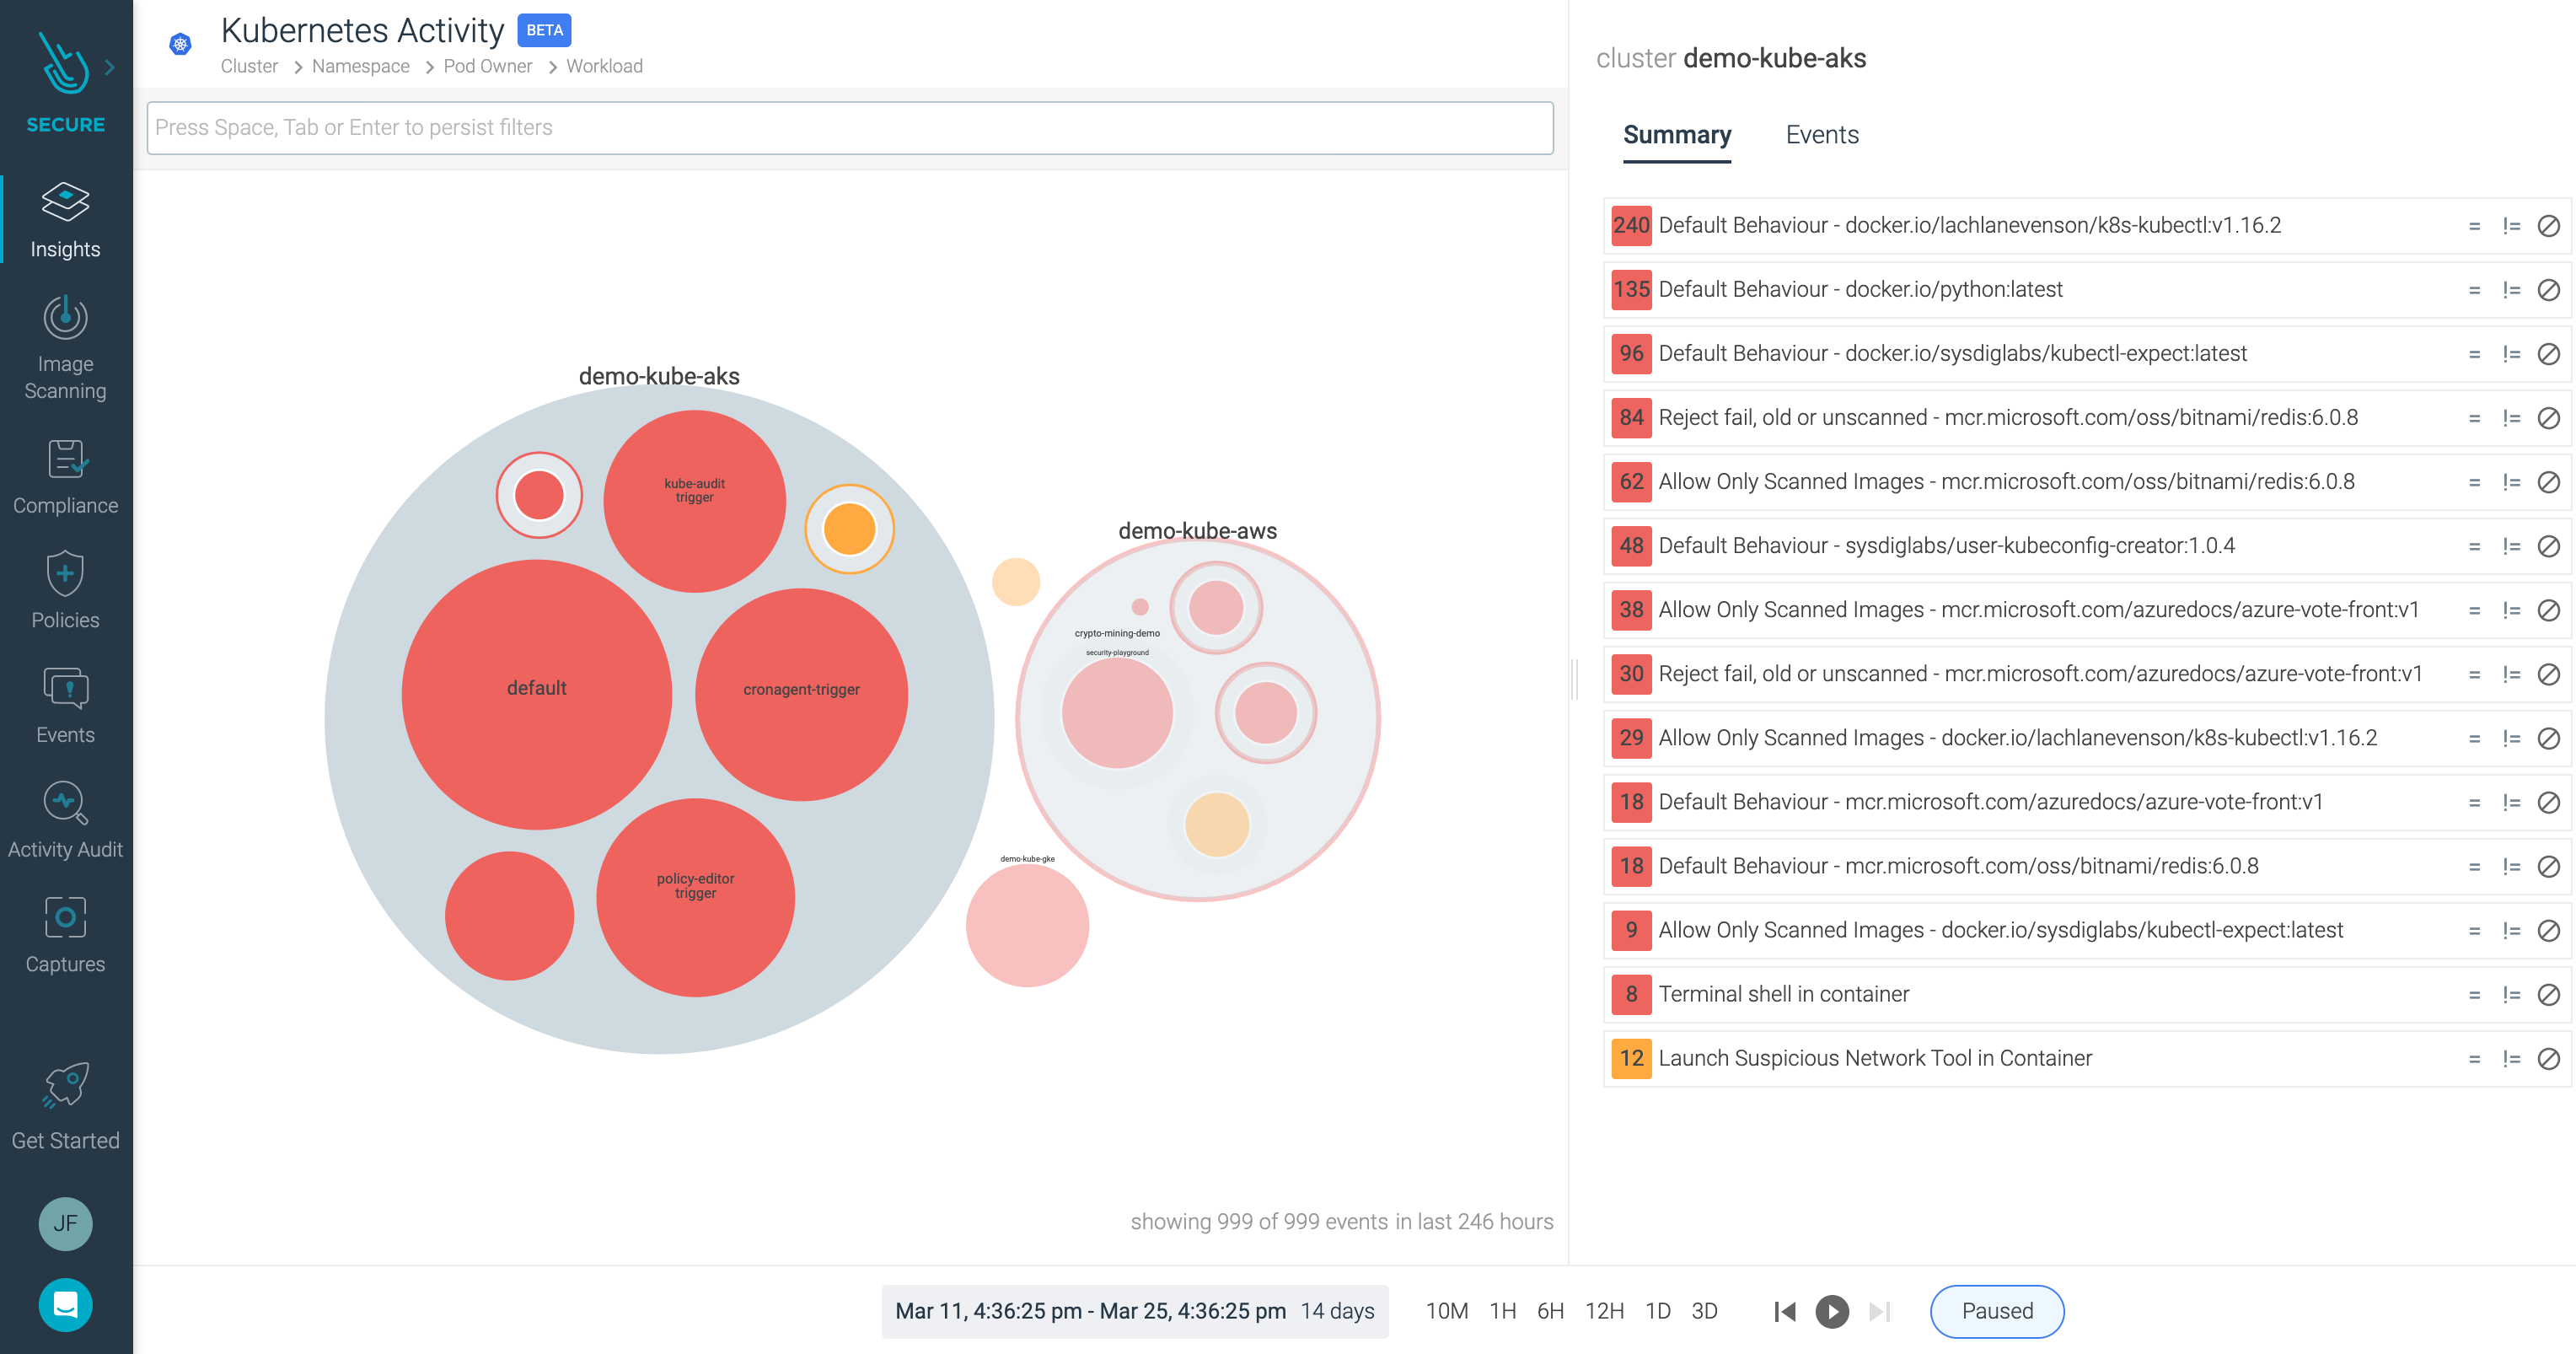
Here you can see all the events aggregated and enriched by Kubernetes metadata.
Click on one of this particular events, and you’ll notice a filter is applied.
We can see on the left more detailed information about this event, including a hierarchy from our Kubernetes infrastructure to host level. This helps us identify the incident: cluster name, namespace, image tags, process name, or the falco rule that triggered the event.